

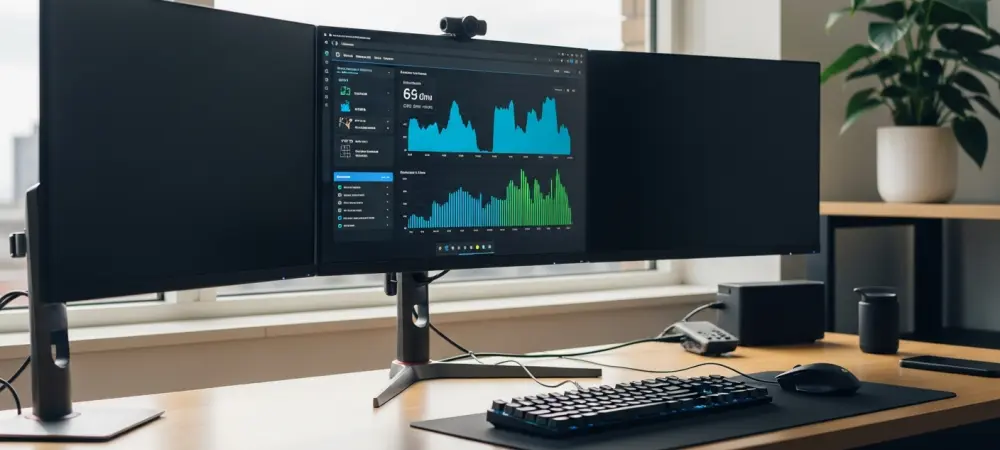
Users navigating the intricate landscape of Linux performance management have often found themselves caught between specialized command-line utilities and fragmented graphical tools that lack a cohesive overview of modern hardware utilization. While traditional monitors like GNOME Resources or System Monitor provide essential basic metrics, the demand for a centralized interface that mirrors the detailed granularity found in proprietary operating systems has remained a significant gap in the desktop experience as hardware complexity continues to rise. Mission Center has emerged as a sophisticated solution built on the robust GTK4 and libadwaita framework, designed specifically to bridge this divide by offering a visually rich and technically precise dashboard. This tool does not merely display static data but interprets real-time hardware telemetry to help developers and enthusiasts diagnose performance bottlenecks with unprecedented ease. By prioritizing a clean design language alongside deep integration with modern display servers like Wayland, the application provides a fluid experience that feels native to any modern Linux distribution.
Expanding Visibility: The Integration of Discrete and Integrated GPU Metrics
Building on the application’s core monitoring capabilities, the recent updates to Mission Center mark a significant milestone by introducing comprehensive GPU monitoring tools that cater to the diverse hardware configurations found in the 2026 computing environment. Previously, Linux users often relied on manufacturer-specific tools or terminal commands like nvidia-smi to gauge graphics card health, which created a disjointed workflow for those managing multi-GPU setups. The new implementation addresses this by aggregating data from various drivers to present real-time utilization rates, memory consumption, and temperature readings within a single unified pane. By leveraging standardized interfaces and modern kernel features, the application can now accurately report on both integrated graphics chips and high-performance discrete cards from major vendors. This level of transparency is essential for creative professionals and gamers who need to ensure that their workloads are distributed correctly across available compute resources without having to dig through system logs or several disparate monitoring windows.
Beyond simple usage percentages, the GPU monitoring stack in Mission Center provides a deep dive into specific engine utilization, such as video encoding and decoding processes. This granularity is particularly beneficial for content creators who rely on hardware acceleration for video editing or streaming, as it allows them to verify that the system is utilizing the dedicated hardware blocks rather than overtaxing the primary processor. The interface employs smooth, high-frequency updates that reflect the dynamic nature of graphics workloads, ensuring that spikes in demand are captured and displayed with minimal latency. Furthermore, the integration of power usage metrics for graphics cards allows mobile users to understand the impact of their visual applications on overall system thermal performance. By consolidating these complex data points into intuitive graphs, the tool provides a clearer picture of how modern graphical APIs interact with the underlying hardware, fostering a more informed approach to system optimization and troubleshooting for all users.
Energy Awareness: Enhanced Battery Life Tracking and Power Management
Portable computing has seen a renewed focus on energy efficiency, and the latest iteration of Mission Center introduces sophisticated battery monitoring tools to help users maximize their unplugged productivity. While basic percentage icons in the system tray provide a surface-level view, they often fail to communicate the underlying health of the battery cells or the specific rate of discharge occurring during heavy multitasking. The new battery tab offers a historical perspective on power consumption, allowing users to identify specific periods of high energy drain and correlate them with specific background applications or hardware activities. This feature is particularly useful in the current technological climate where high-refresh-rate displays and multicore processors can quickly deplete reserves if not managed carefully. By providing detailed information on design capacity versus current health, the application empowers users to make informed decisions about when to seek maintenance or adjust their power profiles to extend the usable lifespan of their devices.
The development of these advanced monitoring features signaled a shift toward a more professional and data-driven approach to the open-source desktop experience. Developers integrated these complex telemetry systems to ensure that users had the necessary tools to maintain their hardware effectively without needing proprietary overlays. This transition toward comprehensive transparency provided a foundation for more efficient resource management across a variety of hardware architectures. By prioritizing these specific updates, the community established a new standard for system utility applications that combined aesthetic appeal with deep technical insight. The introduction of these metrics addressed long-standing requests for better visibility into the background operations of modern graphics and power systems. Ultimately, these enhancements fostered a more stable environment where performance issues were identified and resolved with greater precision. This evolution in monitoring software paved the way for future innovations in automated system optimization and more sustainable personal computing practices for everyone involved.