

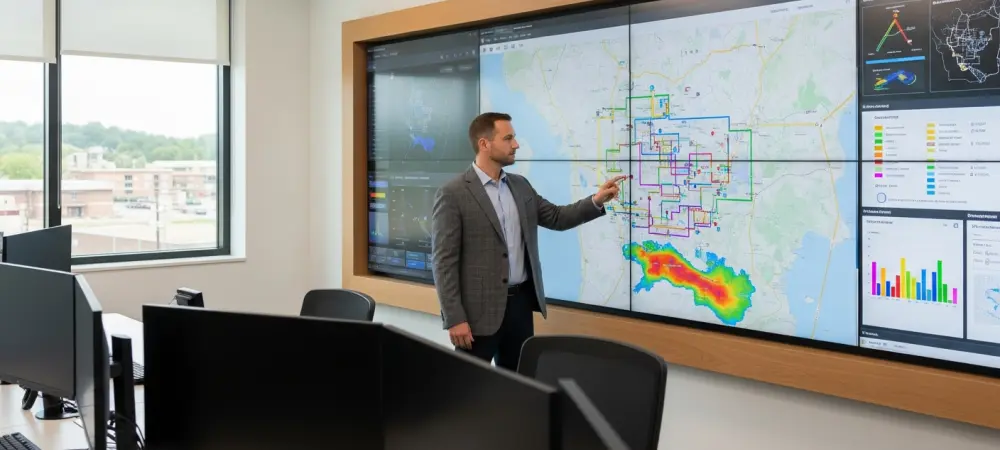
The persistent fluctuation of global energy prices has forced school districts across the country to rethink their traditional approach to yellow bus transportation, turning what was once a routine logistics exercise into a sophisticated data science challenge. For years, transportation departments operated on a reactive basis, simply adding stops or extending routes as new housing developments appeared, but this piecemeal growth often led to profound systemic inefficiencies that drained budgets and increased carbon footprints. Today, the shift toward a strategic, data-centric model is no longer a luxury for affluent districts; it is an absolute necessity for any educational institution aiming to maintain financial health while meeting modern environmental standards. By leveraging routing data, GPS telemetry, and advanced maintenance analytics, administrators are transforming their fleets into highly optimized networks that prioritize the most efficient path for every student. This transition allows transportation directors to move beyond guesswork, using empirical evidence to justify every gallon of fuel consumed and every mile driven. As districts face tighter constraints on both state and local funding, the ability to treat school bus routes as a complex financial equation—rather than a static service—provides a clear path toward long-term operational sustainability.
Tackling Systemic Inefficiency Through Route Design
Modernizing Outdated Paths: The Impact of Geographic Realignment
Many school districts currently operate on routes that were essentially codified a decade ago, suffering from a phenomenon known as “legacy drift” where minor annual adjustments eventually compromise the overall logic of the network. Data analytics allows transportation planners to strip away these historical layers and look at the actual distribution of the current student population against the current road infrastructure. By utilizing Geographic Information Systems (GIS), districts can identify “route shadowing,” where multiple buses travel along the same corridor at different times with low passenger loads. This visual and statistical data enables the consolidation of trips, ensuring that each vehicle operates closer to its maximum capacity while minimizing the total number of engines running at any given time. When software identifies these overlaps, the result is often a significant reduction in the total mileage required to serve the same number of students. Furthermore, modern analytics tools can simulate “what-if” scenarios, allowing planners to see how changing a single stop or merging two routes would impact fuel consumption across the entire fleet before a single bus leaves the yard. This proactive modeling prevents the trial-and-error approach that historically led to wasted fuel and frustrated drivers.
Optimizing stop density and location is another critical component of modernizing paths to save fuel. Every time a forty-ton bus comes to a complete stop and then accelerates back to cruising speed, it consumes a disproportionate amount of fuel compared to steady-state driving. Analytical tools help districts evaluate the safety and efficiency of current stops, often revealing opportunities to move stops to more central locations that serve more students with fewer mechanical interruptions. While individual changes might only save a few ounces of diesel or kilowatt-hours of electricity, the cumulative effect across a district with hundreds of buses is massive. These tools also account for real-world road geometry, such as avoiding left-hand turns that cause idling in traffic or identifying intersections where heavy congestion is known to occur. By redesigning the path to favor right-hand turns and consistent speeds, the software effectively builds fuel efficiency into the very DNA of the route. This level of precision ensures that the primary driver of fuel waste—the inherent design of the trip—is addressed at the source rather than just focusing on secondary factors like driver behavior or vehicle age.
Reducing Empty Miles: Strategic Terminal Placement
One of the most persistent drains on school transportation budgets is “deadhead” mileage, which refers to the distance a bus travels between the terminal and its first stop or between its last stop and the return to the yard. When buses are parked in a central location that is geographically distant from the actual neighborhoods they serve, thousands of miles are wasted every month on empty runs. Advanced data analytics can pinpoint exactly where these inefficiencies occur by calculating the cost of every non-revenue mile driven. In some cases, the data suggests that decentralizing the fleet—utilizing satellite parking lots or smaller regional hubs—can drastically reduce the total distance traveled. By analyzing the heat maps of student residences alongside available municipal property, districts can make informed decisions about where to station their vehicles. This shift not only saves fuel but also reduces the wear and tear on tires and engines that occurs during these unproductive miles. Reducing deadhead distance is essentially found money for a district, as it directly lowers the operational cost per student without requiring any changes to the level of service provided to families.
Beyond physical placement, the synchronization of school bell schedules represents a powerful lever for reducing empty miles through vehicle utilization data. Analytics platforms can model the entire district’s schedule to see if a single bus can perform three consecutive “tiers” of routes—elementary, middle, and high school—with minimal travel time between them. When bell times are poorly aligned, buses often sit idle or return to the yard between runs, only to head back out shortly after, doubling the deadhead mileage for that specific vehicle. By using data to advocate for staggered start times that favor transportation efficiency, administrators can ensure that their fleet remains in constant, productive motion during the peak morning and afternoon windows. This strategy allows a district to serve more students with a smaller total number of buses, which reduces the overall fuel bill and the long-term capital expenditure required for fleet replacement. When data demonstrates the clear financial link between school schedules and fuel waste, it provides transportation directors with the evidence needed to collaborate with school boards on structural changes that benefit the entire community’s bottom line.
Utilizing Technology to Bridge the Gap in Performance
Monitoring Route Variance: Real-World Driver Deviations
Even the most perfectly designed digital route can fail to produce fuel savings if the reality on the asphalt does not match the plan in the office. Telematics and GPS platforms have become essential for monitoring “route variance,” which is the difference between the intended path and the actual path taken by the driver. Often, drivers might take unauthorized detours to avoid a specific intersection they dislike or to find a more convenient place for a break, not realizing that these small deviations add up to significant fuel costs over the course of a school year. Data analytics platforms flag these deviations in real-time, allowing supervisors to see exactly where the plan is breaking down. However, variance isn’t always the fault of the driver; sometimes it reveals legitimate issues that the routing software couldn’t predict, such as permanent road closures, new weight limits on bridges, or areas where overgrown trees prevent a bus from passing safely. By analyzing the data from these deviations, the routing team can update the master plan to reflect reality, ensuring that the “efficient” route is actually one that can be safely and consistently driven by the staff.
The visibility provided by telematics also allows for a deeper understanding of how external factors like traffic congestion and weather impact fuel economy on specific days. For instance, data might show that a route which is highly efficient at 6:30 AM becomes a major fuel-waster if delayed by just fifteen minutes, as it then hits the peak of local commuter traffic. By analyzing these time-based performance metrics, transportation managers can make micro-adjustments to departure times or re-route buses away from known bottlenecks during specific windows of the day. This level of granular oversight transforms the management process from a monthly review of fuel receipts into a daily optimization exercise. When supervisors can point to a specific map and show a driver exactly where an extra two miles were added due to a missed turn or an unauthorized bypass, it creates a culture of accountability that directly supports the district’s efficiency goals. Over time, bridging this gap between the office-based plan and the driver-executed reality ensures that the theoretical fuel savings predicted by software actually materialize as lower costs in the district’s financial reports.
Enhancing Driver Collaboration: From Data to Asphalt
While technology provides the numbers, the drivers are the ones who ultimately control the fuel pedal, making their buy-in essential for any data-driven efficiency initiative. Rather than using analytics as a punitive tool, forward-thinking districts are using performance data to foster a collaborative environment focused on professional development. Telematics can identify specific driving habits that contribute to high fuel consumption, such as “jackrabbit” starts, hard braking, and excessive speeding, all of which force the engine to work harder and burn more fuel. By sharing this data with drivers in a transparent, non-confrontational way, supervisors can provide targeted coaching that helps staff improve their skills. Many districts have even implemented incentive programs where drivers who consistently meet or exceed fuel-efficiency benchmarks receive recognition or small bonuses. This gamification of efficiency turns fuel conservation into a shared goal, where drivers take pride in their ability to operate their vehicles as smoothly and economically as possible. When drivers understand that the data is there to support their success and safety, they become the most effective advocates for the district’s sustainability efforts.
Continuous communication between the routing team and the frontline drivers creates a feedback loop that refines the entire operation over the long term. Drivers often possess localized knowledge that data alone might miss—such as a particularly steep driveway that causes a bus to scrape its tail or a specific stop where a student consistently requires more time to board. When this qualitative feedback is combined with quantitative telematics data, the district can create “hyper-optimized” routes that are both fuel-efficient and operationally realistic. For example, a driver might suggest a slight change to the order of stops that reduces the amount of time the bus spends idling on a steep uphill grade. The analytics team can then verify the potential fuel savings of this suggestion using their software. This collaborative approach ensures that the people behind the wheel feel valued and heard, which reduces turnover and keeps experienced, efficient drivers on the road. By treating the data as a conversation starter rather than an ultimatum, districts build a resilient culture where efficiency is viewed as a hallmark of professional excellence rather than a burdensome requirement from the administration.
Analyzing the Impact of Infrastructure and Terrain
Optimizing Vehicle Longevity: Road Surface and Grade Analysis
The physical environment in which a bus operates has a profound impact on its fuel efficiency and the speed at which its components degrade. Data analytics can provide a bird’s-eye view of how different road conditions—such as unpaved gravel, broken asphalt, or steep vertical grades—affect the fleet’s performance over time. Telematics sensors can detect the increased vibration and engine strain associated with poor road surfaces, allowing transportation managers to quantify the “hidden cost” of certain routes. In many cases, the data reveals that taking a slightly longer route on a well-maintained highway is actually more fuel-efficient and cost-effective than taking a shorter “shortcut” over a rough, hilly backroad. The extra mileage is often more than offset by the reduction in fuel burned during high-torque climbing and the lower maintenance costs for suspension and braking systems. By mapping these high-stress corridors, districts can work with local public works departments to prioritize repairs on critical bus routes or adjust their routing logic to avoid the most damaging segments of the local infrastructure.
Beyond fuel consumption, analyzing the relationship between terrain and vehicle health allows for more precise maintenance scheduling that prevents catastrophic failures. For instance, buses that primarily serve routes with significant elevation changes will inevitably experience faster wear on their brake pads and transmission systems compared to those on flat, suburban streets. Data-driven maintenance platforms can track these environmental variables and trigger inspections based on actual mechanical stress rather than just a fixed number of months or miles. This predictive approach ensures that a bus operating in a high-intensity environment receives the attention it needs before a minor issue becomes an expensive repair or a breakdown that leaves students stranded. By understanding the geography of the district through a data lens, managers can also make better decisions about where to deploy specific types of tires or engine configurations that are better suited for the local terrain. This level of oversight ensures that the fleet is not only fuel-efficient in the short term but also remains a viable, long-lasting asset for the community for years to come.
Matching Fleet to Geography: Strategic Asset Deployment
In a diverse school district, not every bus is equally suited for every route, and using data to match the right vehicle to the right terrain is a cornerstone of modern fleet management. For example, a large, heavy diesel bus equipped with supplemental braking systems like an electromagnetic retarder is much more efficient and safer for routes involving long, steep descents in rural or mountainous areas. Conversely, an electric school bus might be the ideal choice for a dense, urban route with frequent stops, where its regenerative braking system can capture energy that would otherwise be wasted. By deploying the most fuel-efficient engine and drivetrain for a specific route’s profile, districts can squeeze maximum value out of every gallon or kilowatt-hour. This strategic assignment prevents the unnecessary fuel waste that occurs when an underpowered vehicle struggles on hills or when a heavy-duty bus is underutilized on a flat, low-speed suburban loop.
The data gathered from these geographic assignments also plays a critical role in the district’s long-term procurement strategy. When it comes time to replace aging vehicles, administrators can look at several years of performance data to determine exactly what specifications they need for the next generation of their fleet. If the data shows that a significant portion of the district’s fuel waste occurs during stop-and-go traffic in a specific zone, they might prioritize hybrid or electric replacements for those specific routes. If the data highlights the durability of a certain engine model in extreme cold or high-heat environments, that information becomes the primary driver for future bids. This evidence-based purchasing ensures that the district isn’t just buying the cheapest bus available, but the one that will offer the lowest total cost of ownership over its entire lifespan. By treating the fleet as a collection of specialized tools rather than a uniform set of vehicles, transportation directors use data to build a more resilient and efficient system that is perfectly tailored to the unique physical demands of their local community.
Strengthening Policies and Financial Oversight
Enforcing Smart Idling: Balancing Comfort and Conservation
Idling is often cited as the single most avoidable source of fuel waste and unnecessary emissions in school transportation, yet it remains a persistent challenge for many districts. Modern routing and telematics software have revolutionized how this issue is managed by providing a clear, objective view of when and where engines are running without the vehicle moving. However, data analytics also allows for a more nuanced approach that distinguishes between “wasteful” idling and “necessary” idling. For instance, a bus must often idle to operate a wheelchair lift for a student with special needs or to maintain climate control for a student with a specific medical condition. Advanced software can filter out these legitimate events by cross-referencing GPS data with passenger manifest information, allowing supervisors to ignore the “good” idle time and focus exclusively on the instances where a driver is simply sitting with the engine running unnecessarily. This targeted oversight makes the enforcement of anti-idling policies much more effective and fair, as it is based on the actual context of the situation rather than a raw, misleading number.
The financial and environmental impact of reducing unnecessary idling is immediate and easily quantifiable, providing a clear “win” for any district’s sustainability program. Research has consistently shown that just one hour of idling can burn a significant amount of fuel and contribute to premature engine wear by causing soot buildup and oil contamination. By using data to coach drivers on the high cost of this habit, districts can often see a double-digit reduction in fuel consumption in just a few months. Furthermore, reducing idling at school sites significantly improves the air quality for students waiting to board, which aligns with broader public health goals. Some districts have even integrated their idling data with public-facing “green dashboards,” showing the community exactly how much fuel and carbon emissions have been saved through these policy changes. This level of transparency builds public trust and demonstrates that the transportation department is being a responsible steward of both taxpayer dollars and the local environment. When data makes the invisible waste of idling visible, it becomes a powerful motivator for change across the entire organization.
Improving Procurement: Financial Analytics and Fleet Cards
Fuel efficiency isn’t just about how much energy the buses burn; it’s also about the precision and security with which that energy is purchased and tracked. Many districts have moved away from bulk on-site tanks in favor of specialized fleet card programs that offer a wealth of data for financial oversight. These cards can be programmed with strict controls, requiring drivers to enter their unique PIN and the vehicle’s current odometer reading before every transaction. This data allows the district to automate the recovery of federal and state fuel tax exemptions, which are often missed or incorrectly filed when using manual systems. By capturing this data at the point of sale, the district ensures that every cent of eligible tax rebate is returned to the budget. Additionally, the analytics provided by fleet card companies can flag “fuel slippage” or potential fraud, such as when a transaction exceeds the tank capacity of the vehicle or when two fill-ups occur in an impossibly short timeframe. This level of security protects the district’s resources and ensures that every dollar spent on fuel is actually going into the tank of a school bus.
Beyond security, the aggregation of fuel purchase data allows districts to participate in sophisticated procurement programs that leverage their total volume for better pricing. By analyzing their historical consumption patterns, transportation directors can enter into “hedging” contracts or volume-based rebate programs that stabilize the fuel budget against sudden market spikes. This financial data also helps administrators compare the true cost of different fuel types—such as diesel versus propane or compressed natural gas—by looking at the total cost per mile rather than just the price per gallon. When all the costs of procurement, taxes, and rebates are factored into the equation, a district might find that an alternative fuel which looks more expensive on the surface is actually more cost-effective in the long run. This holistic view of fuel management, powered by robust financial analytics, ensures that the transportation department is operating with the same level of sophistication as a private logistics firm. By modernizing how energy is bought and tracked, school districts can maximize the impact of every dollar, ensuring that the primary focus remains on the safe and efficient transport of the next generation.
Advancing Efficiency Through Comprehensive Data Integration
The transition toward a data-driven model for school transportation demonstrated that significant fuel savings were achievable when technology and policy worked in unison. By identifying the root causes of mileage waste—ranging from outdated route designs and excessive deadhead travel to the subtle impact of terrain and driver habits—districts transformed their operations from a series of educated guesses into a precise science. The integration of telematics, GIS software, and financial analytics provided a level of visibility that was previously impossible, allowing administrators to account for every gallon of fuel consumed. This comprehensive approach did more than just lower the monthly fuel bill; it extended the lifespan of vehicles, improved the safety of the routes, and enhanced the professional skills of the driving staff. When the transportation department utilized empirical evidence to back up their operational changes, they were able to secure more stable funding and build stronger relationships with school boards and the communities they served. The success of these initiatives proved that even small, data-informed adjustments could lead to massive cumulative benefits across a large fleet of buses.
Looking ahead, the most successful districts were those that moved beyond simple data collection and embraced a culture of continuous optimization. They established regular review cycles where routing teams and drivers collaborated to refine paths based on real-world feedback and telematics reports. These organizations also invested in ongoing training, ensuring that their staff understood the “why” behind the new efficiency policies, which led to higher rates of compliance and better morale. As energy landscapes continued to shift, the districts that had already built a robust data infrastructure were much better positioned to evaluate and integrate new technologies, such as electric vehicles and autonomous safety features. They treated their data as a strategic asset, using it to navigate the complexities of budgeting and environmental mandates with confidence. By prioritizing this high-tech approach, school systems ensured that their transportation programs remained financially viable and environmentally responsible, ultimately directing more resources back into the classroom where they could benefit students directly. This evolution in fleet management set a new standard for how public institutions can leverage technology to achieve excellence in both service and sustainability.