

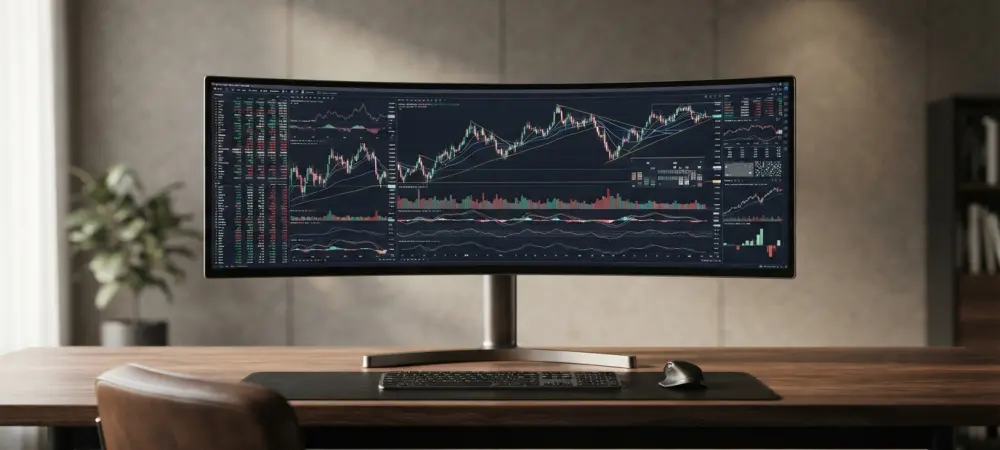
The sheer complexity of modern cryptocurrency markets means that a simple glance at a daily volume figure reveals nothing more than a superficial layer of a deep, multi-dimensional data ocean. For years, investors treated volume as a simple speedometer, yet the mechanics behind these numbers have evolved into a sophisticated discipline of data forensics. In the current landscape of 2026, where institutional participation is the norm rather than the exception, the ability to distinguish between organic liquidity and algorithmic noise has become the primary barrier between informed strategy and reactive gambling. This shift toward a more critical interpretation of data is not merely a technical necessity but a fundamental requirement for market survival in a decentralized economy.
Modern trading environments have transcended the era of isolated exchanges that operated in informational silos. The current scale of the market indicates that daily activity regularly reaches hundreds of billions of dollars, a figure that would have been unthinkable just a few years ago. This massive growth, however, has not simplified the tracking process; instead, it has necessitated the development of advanced aggregation engines. Because there is no central authority or consolidated tape for digital assets, every volume figure is a careful construction. Data engineers must pull from thousands of disparate API feeds, normalizing timestamps and currency conversions to present a coherent picture of global demand.
Decoding the Evolution of Market Activity Data
The move toward absolute transparency has forced a total reevaluation of how trading activity is reported across the globe. By 2026, the industry has largely abandoned the practice of accepting raw exchange data at face value. Instead, sophisticated tracking platforms apply rigorous “real volume” filters to remove wash trading and other forms of artificial inflation. These filters utilize statistical modeling to ensure that the reported volume aligns with the actual depth of an exchange’s order book. This transformation ensures that global liquidity is reflected as an accurate measure of economic interest rather than a byproduct of competitive exchange marketing or automated loop trading.
Furthermore, the structural nuances of the market have led to a clear distinction between different tiers of liquidity. The evolution of reporting now prioritizes venues that adhere to strict regulatory standards and data verification protocols. This creates a stratified view of the market where “clean” volume is separated from speculative noise. Consequently, analysts can identify where the most reliable price discovery is occurring. This methodological shift has turned volume tracking from a passive observation into an active verification process, allowing participants to ignore the inflated statistics often generated by less reputable offshore platforms.
Global Adoption: The Rise of Aggregated Data
As global adoption reaches its current peak in 2026, aggregated data has become the bedrock of institutional market analysis. The fragmentation of liquidity across hundreds of international jurisdictions means that no single venue can offer a complete view of an asset’s health. Aggregators solve this by providing a unified interface that reconciles the price and volume discrepancies found between different regions. This is particularly important for large-scale players who need to see the “big picture” before executing trades. Without these aggregation layers, the market would remain a collection of disconnected price islands, making it impossible to determine the true value of an asset.
The transition to a more unified data landscape has also empowered retail investors with tools that were once the exclusive domain of high-frequency trading firms. Modern dashboards now offer real-time updates that reflect the combined activity of both spot and derivatives markets. This level of insight allows for a better understanding of how money flows between different segments of the economy. For instance, an increase in aggregated volume across several major exchanges often confirms a trend, whereas a volume spike on a single, isolated platform is usually dismissed as an outlier or a localized anomaly.
Real-World Application: Advanced Volume Trackers
Advanced tracking systems have introduced side-by-side analysis of spot and futures data, which is essential for decoding market intent. In the current 2026 environment, it is common to see derivatives volume significantly outpace spot activity, reflecting a highly leveraged market. By utilizing tools that separate these two figures, traders can determine if a price move is driven by long-term accumulation or short-term speculation. For example, when spot volume leads a rally, it typically suggests a healthier, more sustainable trend compared to a rally fueled purely by perpetual swap liquidations and leveraged bets.
Asset managers also use these tracking mechanics to perform volume distribution analysis, a critical step for managing large portfolios. This involves looking at the specific price levels where the most trading occurs, helping to identify strong support and resistance zones. By understanding the liquidity profile of an altcoin, a manager can plan entries and exits that minimize slippage and avoid disturbing the market price. Meanwhile, exchanges utilize this data to benchmark their competitive standing, often adjusting their fee structures to incentivize higher organic activity and improve the overall quality of their order books.
Expert Perspectives: Data Integrity and Interpretation
Industry leaders emphasize that the “where” and “how” of market activity are often more informative than the total dollar amount reported in a headline. A single 24-hour total can hide massive discrepancies in how individual exchanges report their internal trades. Experts suggest that volume must be interpreted as a narrative of participant behavior. When activity spikes are synchronized across all major reputable venues, it confirms a global shift in sentiment. However, if the volume is concentrated on a single exchange with opaque reporting, it serves as a red flag for technical manipulation or artificial inflation.
From a technical standpoint, every volume dashboard is a continuous project that requires constant engineering oversight. Data engineering specialists highlight that API changes, token renames, and unexpected server outages are daily challenges that can corrupt a data feed if not handled properly. Maintaining a reliable tracker in 2026 involves more than just collecting numbers; it requires a sophisticated infrastructure that can flag and isolate anomalies in real time. This behind-the-scenes labor is what allows professional analysts to trust the figures they see on their screens, knowing that the data has been scrubbed for technical errors.
Professional analysts further warn against the simplistic view that high volume is always a bullish signal. They reinforce the idea that volume is a measure of intensity, not direction. A catastrophic sell-off and a vertical rally can produce identical volume bars on a chart, meaning that context is everything. To gain this context, experts recommend pairing volume with other metrics like open interest or the funding rate. High volume combined with rising open interest indicates the arrival of new capital, while high volume with falling open interest suggests that existing traders are being flushed out of their positions.
Future Projections: The Role of Standardized Reporting
The future of market tracking likely involves a transition toward standardized reporting protocols between 2026 and 2028. This shift would aim to eliminate the construction bias currently found in most third-party dashboards by establishing a universal language for crypto trade reporting. As institutional demand for transparency grows, exchanges may be forced to adopt audit-ready data feeds that resemble the consolidated tapes used in traditional equity markets. Such a development would significantly reduce the influence of unreliable venues and provide a clearer, more honest view of global digital asset demand.
Moreover, the integration of on-chain data with centralized exchange volume is expected to become the new industry standard. This holistic approach provides a clearer picture of how assets move between private wallets and active trading environments. Watching assets flow onto an exchange is often a leading indicator of upcoming trading activity, and merging this with centralized data offers a more predictive analytical framework. While AI-driven filtering will continue to improve the detection of wash trading, the inherent decentralized nature of the market ensures that volume tracking will remain a dynamic challenge requiring the most advanced analytical tools available.
Summary of Key Insights: Navigating Market Data
This analysis highlighted that cryptocurrency volume functioned as a multi-layered assembly of data rather than a simple, monolithic figure. Success in reading market activity depended on using consistent sources that differentiated between spot ownership and leveraged speculation. It was observed that professional participants compared current volume figures against historical ranges to identify significant shifts in market momentum. The move toward “real volume” metrics proved to be a decisive factor in separating genuine economic demand from the noise of artificial activity that once dominated the headlines.
The industry moved toward a philosophy of quality over quantity, where the source of volume became as important as the magnitude of the trades. Stakeholders who prioritized data integrity found that they could navigate the volatility of the digital asset economy with much greater precision. As standardized reporting began to take hold, the transparency of the market improved, allowing for more reliable price discovery. Ultimately, the ability to decode these tracking mechanics provided a substantial competitive advantage for anyone seeking to understand the true pulse of the global cryptocurrency ecosystem.