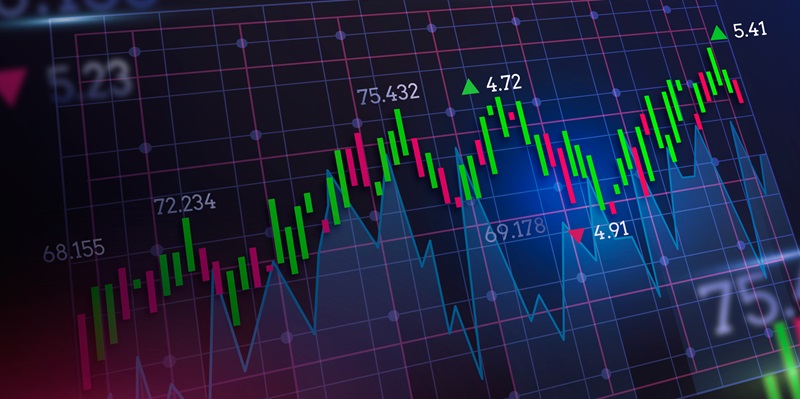
The cryptocurrency market is a complex and volatile space where understanding trends and patterns is crucial for successful trading. In order to navigate this market effectively, traders must possess the knowledge and skills to analyze and interpret these patterns. This article aims to shed light on the importance of recognizing and understanding cryptocurrency chart patterns and how they play a pivotal role in technical analysis for managing market behavior. Additionally, we will explore the various types of crypto patterns, their significance, and the key insights they offer to traders.
The role of patterns in technical analysis
Technical analysis is a methodology used by traders to forecast the future price movements of cryptocurrencies. It involves analyzing historical price data to identify patterns and trends that could potentially repeat in the future. Chart patterns serve as tools in technical analysis, providing valuable insights into market sentiment and potential price movements.
Managing market behavior becomes easier when traders are able to identify and interpret these patterns accurately. They enable traders to make informed decisions, plan entry and exit points, set stop-loss orders, and predict potential price targets. However, recognizing and understanding these patterns requires experience and expertise. If you find yourself struggling with chart patterns, seeking assistance from platforms like Bitogrand can be immensely helpful.
Types of cryptocurrency chart patterns
Crypto chart patterns can be classified into different types based on their formations and trends. Recognizing and comprehending these patterns is crucial for traders who wish to stay ahead in the market. Let’s delve into some of the most prominent ones.
The cup and handle pattern is one of the earliest and most significant chart patterns in cryptocurrency trading. This pattern generally indicates the continuation of an existing bullish trend. It is characterized by a cup-shaped formation followed by a small consolidation, forming a handle. Traders often interpret this pattern as a potential signal to enter or add to a long position.
Among the most famous trends in the crypto market, head and shoulder patterns often signal an upcoming trend reversal. This pattern consists of three peaks, with the middle peak being the highest (the head), flanked by two smaller peaks (the shoulders). The neckline, formed by connecting the low points between the three peaks, plays a critical role in confirming the pattern. A breakdown below the neckline is considered a bearish signal, while a breakout above it indicates a potential upward trend.
Ascending and descending triangles are common chart patterns in the cryptocurrency market. Ascending triangles are characterized by a series of higher lows combined with a horizontal resistance level. This pattern tends to indicate a bullish bias and could result in a potential price breakout to the upside. On the other hand, descending triangles are formed when a series of lower highs meet a horizontal support level, indicating a potential bearish trend and the possibility of a breakdown in prices.
Technical Analysis and Market Signals
Technical analysis is a crucial tool for traders as it provides insights into market signals. By assessing price data, technical analysis allows traders to decipher the underlying market sentiment and make informed decisions. This analysis involves the use of various indicators, chart patterns, and other mathematical calculations to predict future price movements.
Understanding market signals is essential for traders to identify potential opportunities and manage risk effectively. By utilizing technical analysis in conjunction with chart patterns, traders can spot signals such as trend reversals, breakouts, and bullish or bearish market sentiments. These signals empower traders to take decisive actions at the right time, improving their chances of profitability.
Mastering the art of understanding cryptocurrency chart patterns is essential for success in the ever-fluctuating crypto market. By recognizing and interpreting these patterns, traders can gain valuable insights into market behavior, enabling them to make informed trading decisions. Through technical analysis and chart pattern recognition, traders can identify potential opportunities, manage risk efficiently, and increase their chances of profitability.
If you find yourself struggling to understand crypto chart patterns, don’t hesitate to seek assistance from reliable platforms such as Bitogrand. Remember, the cryptocurrency market is highly dynamic, and continuous learning and exploration are vital to staying ahead. Embrace the challenge and let your knowledge of chart patterns be your guiding light in the ever-evolving world of cryptocurrency trading.

