

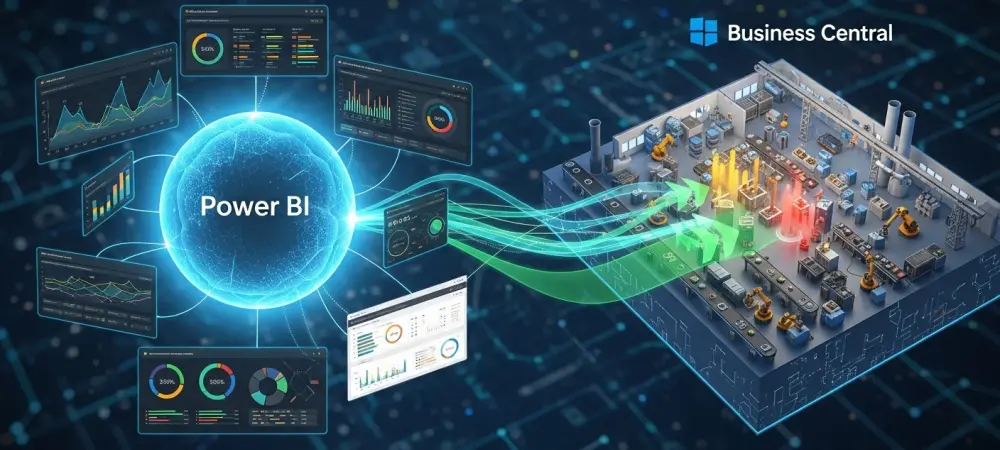
The realization that massive streams of production data often sit idle within an enterprise resource planning system highlights a significant gap in modern manufacturing competitiveness. While Microsoft Dynamics 365 Business Central excels at capturing transactional details, the sheer volume of production orders, routing steps, and material movements can overwhelm manual analysis. This article serves as a comprehensive guide for organizations seeking to bridge the divide between raw data collection and strategic insight by leveraging the integration of Power BI. The objective is to explore how this technological synergy answers critical operational questions, optimizes capacity, and safeguards profit margins in a rapidly evolving industrial landscape.
Readers can expect an in-depth analysis of the Microsoft Power BI Manufacturing app, focusing on how its pre-built frameworks address common production challenges. The scope of the discussion includes technical considerations for data architecture, the importance of role-specific dashboards, and the strategic shift toward predictive analytics. By the end of this exploration, it will be clear how a unified intelligence strategy transforms an ERP from a simple system of record into a dynamic tool for operational excellence.
Key Questions or Key Topics Section
How Does the Power BI Manufacturing App Transform Raw Data Into Intelligence?
The standard analytical framework provided by Microsoft serves as a critical translation layer for complex ERP data. Within the Dynamics 365 Business Central environment, production information is stored across multiple ledgers, including capacity, item, and value entries, which makes manual cross-referencing a labor-intensive task. The Power BI Manufacturing app addresses this by utilizing a pre-configured semantic model that organizes these disparate data points into a cohesive structure. This allows users to view the entire production lifecycle from a single vantage point, moving away from fragmented spreadsheets toward a unified digital reality.
By deploying this “standard-first” approach, a manufacturer can immediately validate its operational health against its internal records. The app provides visual representations of capacity ledger entries and routing data, enabling a quick assessment of output versus planned goals. This automated aggregation reduces the time spent on data preparation, allowing managers to focus on interpreting trends rather than building reports. Consequently, the organization gains the agility to respond to market shifts with evidence-based strategies rather than relying on intuition alone.
What Role Do Semantic Models Play in Simplifying Complex Production Data?
The architectural backbone of high-level manufacturing reporting lies in the semantic model, which acts as a bridge between the technical database and the end-user interface. In Business Central, the relationship between a Work Center, its assigned Capacity, and the actual Output recorded in the journal is often obscured by complex table structures. A well-designed semantic model flattens these relationships, presenting information in a language that production managers and floor supervisors can understand. This simplification is essential for ensuring that the intelligence gathered is accessible to those who are not data scientists but need accurate facts to run their shifts.
Furthermore, these models allow for standardized calculations across the entire enterprise, ensuring that a “scrap rate” or “utilization percentage” means the same thing in every department. Without this underlying structure, different teams might calculate efficiency differently, leading to conflicting reports and stalled decision-making. By centralizing the logic within Power BI, the organization ensures that every report generated from the model adheres to the same business rules. This consistency fosters a culture of accountability where data is trusted as an impartial arbiter of performance.
How Can Manufacturers Identify and Resolve Shop Floor Bottlenecks?
Identifying a bottleneck before it stops production is the difference between meeting a shipping deadline and incurring late fees. Power BI facilitates this through sophisticated load analysis, which compares the future demand of production orders against the available hours in a Work Center or Machine Center. Instead of looking at a static calendar, managers can view a “load curve” that highlights upcoming periods where demand exceeds capacity. This visibility allows for proactive adjustments, such as reassigning labor, authorizing overtime, or moving production to an alternative facility.
Moreover, the visualization of historical utilization patterns helps in distinguishing between temporary spikes and systemic issues. If a specific machine is consistently running at its theoretical maximum while others are idle, the data provides the necessary justification for capital investment or process redesign. By analyzing the “active” versus “idle” time recorded in the capacity ledger, organizations can pinpoint exactly where friction exists in the flow. Addressing these constraints toward a more balanced workload results in shorter lead times and a more predictable production schedule.
In What Way Does Variance Analysis Protect Manufacturing Profit Margins?
Protecting margins in a high-cost manufacturing environment requires a relentless focus on the gap between expected and actual performance. Power BI enables real-time variance analysis by comparing the “Standard Cost” of a production order with the “Actual Cost” incurred through material consumption and labor time. When these two figures diverge, dashboards can automatically flag the discrepancy, allowing finance teams to investigate the root cause immediately. This prevents a minor operational inefficiency from snowballing into a major quarterly loss.
The ability to drill down into specific cost drivers is where the true value of this integration becomes apparent. For instance, a manager can determine if a cost overrun was caused by an increase in raw material prices (consumption variance) or by a machine running slower than the routing predicted (capacity variance). Whether it involves renegotiating vendor contracts or retraining machine operators, the decision is supported by hard data that directly impacts the bottom line. This level of granularity ensures that the corrective action is targeted and effective.
Why Is a Standard-First Approach Recommended for Implementation?
Adopting a “standard-first” philosophy when integrating Power BI with Business Central is a strategic move that prioritizes speed and data validation. Microsoft’s out-of-the-box Manufacturing app provides a wealth of pre-configured KPIs that cover the vast majority of standard production needs. This initial phase serves as a critical testing ground, allowing the business to identify any gaps in its ERP data entry or posting processes before committing to expensive custom development.
Furthermore, this approach provides a baseline of functionality that helps users become familiar with the Power BI interface and its capabilities. Once the standard reports are validated and the internal team is comfortable with the data flow, the organization can then move on to more complex tailoring. This iterative process reduces the risk of project failure and ensures that any custom work is built on a solid, functional foundation. It also allows the business to realize a return on investment much earlier in the implementation cycle.
How Does Real-Time Scrap Tracking Improve Material Consumption Efficiency?
Scrap is often viewed as an unavoidable byproduct of manufacturing, but tracking it in real-time through Power BI turns it into an actionable quality metric. By visualizing scrap reasons and quantities by item or work center, managers can identify patterns that might otherwise go unnoticed. For example, if a certain raw material consistently results in higher scrap rates when processed on a specific machine, the data might suggest a compatibility issue or a need for machine calibration. This proactive identification of waste helps in refining the Bill of Materials and the production routings.
Moreover, scrap analysis can be extended to vendor performance evaluation. If material from a specific supplier consistently leads to production waste, the procurement team has the empirical evidence needed to hold that vendor accountable. By reducing scrap, the organization not only saves on material costs but also recovers the lost capacity that was spent processing defective goods. This creates a virtuous cycle of improvement where higher quality leads to better efficiency and, ultimately, a more competitive price point for the end customer.
How Should Dashboards Be Tailored for Different Organizational Roles?
A common pitfall in business intelligence is providing the same level of detail to every user, regardless of their role. To be effective, Power BI dashboards must be segmented into executive, operational, and tactical views. An executive dashboard should focus on high-level health indicators, such as overall equipment effectiveness, total production output, and aggregate cost performance. These users need to see the big picture to make long-term strategic decisions without being bogged down by the minutiae of individual production orders.
In contrast, a shop floor supervisor requires a tactical view that emphasizes the “here and now.” Their dashboard should highlight current work center loads, overdue production orders, and immediate quality alerts. By catering to the specific needs of each role, the organization ensures that the data is not just interesting, but truly useful. This role-based architecture prevents information overload and ensures that everyone is looking at the metrics most relevant to their responsibilities.
What Are the Critical Licensing and Economic Considerations?
While the technological benefits of Power BI are clear, organizations must navigate the licensing landscape to ensure a sustainable deployment. Every user who needs to interact with or refresh the reports typically requires a Power BI Pro or Premium license. Additionally, the underlying data source requires a Business Central license to maintain the connection. These costs can add up, particularly for larger organizations with hundreds of employees across multiple shifts who need access to the data.
Beyond the per-user licensing, there are also capacity-based costs to consider. Organizations with high data volumes or those requiring frequent updates may need to invest in Power BI Premium capacity to avoid performance bottlenecks. This investment must be weighed against the expected gains in efficiency and cost savings. When viewed as a strategic investment, the licensing costs are often dwarfed by the operational improvements they enable. A thorough economic analysis should account for the reduction in manual reporting labor, the savings from improved capacity utilization, and the margin protection gained through better variance tracking.
How Does Data Freshness Impact Shop Floor Decision-Making?
The velocity of data is a crucial factor in the effectiveness of manufacturing intelligence. In a fast-paced production environment, a report that is 24 hours old may already be obsolete. A manufacturer must align its data refresh schedule with its actual production cycle. A facility producing high-volume consumer goods with short cycle times requires near-real-time data to catch errors before they result in thousands of wasted units.
Conversely, a manufacturer with long lead times and multi-week production orders may find that a few updates per day are more than sufficient. The key is to find the “sweet spot” where data is fresh enough to be actionable without putting unnecessary strain on the ERP system’s performance. It is important to remember that every data refresh consumes resources, and an overly aggressive schedule can slow down the very Business Central environment it is trying to monitor. Balancing data velocity with system stability is a hallmark of a mature manufacturing intelligence strategy.
Why Is Data Integrity in Business Central Crucial for Power BI Success?
The most advanced Power BI dashboard is only as reliable as the data flowing into it from Business Central. This principle, often referred to as “Garbage In, Garbage Out,” is particularly relevant in manufacturing where complex routings and consumption journals are the primary data sources. High-quality reporting begins with disciplined data entry at the point of activity. If shop floor workers are not accurately recording their time or if material consumption is only estimated rather than measured, the resulting Power BI reports will be misleading.
To ensure success, organizations should implement validation procedures that compare Power BI outputs with known reliable figures in the ERP. This might involve cross-referencing total produced quantities or total capacity hours for a given period. If discrepancies are found, the focus should shift toward improving the Business Central processes rather than adjusting the Power BI report. Once the transactional data is accurate and consistent, the intelligence layer can be trusted to guide high-stakes decisions. This foundation of data integrity is the prerequisite for any meaningful digital transformation.
When Should a Manufacturer Move Beyond Standard Reporting to Custom Solutions?
While the standard Microsoft app is powerful, there are specific scenarios where custom Power BI development becomes a necessity rather than a luxury. One such scenario is the integration of external data sources, such as Internet of Things sensors located directly on machinery. While Business Central tracks the results of production, IoT sensors can provide data on machine temperature, vibration, and energy consumption in real-time. Blending these signals with ERP data allows for a much deeper understanding of the factors that influence production quality and machine health.
Another trigger for custom development is the presence of unique, industry-specific KPIs that are not part of the standard manufacturing model. For instance, a chemical manufacturer may need specialized reporting on batch potency or environmental compliance that falls outside the scope of a general manufacturing app. In these cases, the organization should build upon the existing semantic model rather than starting from scratch. This allows them to maintain the benefits of the standard integration while layering on the specialized insights that provide their specific competitive advantage.
How Can Organizations Achieve a Bird’s-Eye View in Multi-Company Environments?
For enterprises operating across multiple legal entities or global plants, the “per-company” nature of many standard ERP reports can be a significant hurdle. Consolidating this data to gain a bird’s-eye view of the entire organization requires a more advanced data architecture, often involving Microsoft Fabric or a dedicated data warehouse. These tools allow for the “mirroring” of data from multiple Business Central environments into a single workspace, where it can be harmonized and analyzed as a whole. This consolidated view is essential for corporate leadership to compare performance across different regions and identify global trends.
Achieving this level of integration requires careful attention to data standardization. If one plant uses different units of measure or currency than another, the data must be normalized before it can be accurately compared. This often involves a “master data management” strategy that ensures consistency across all entities. Once this hurdle is cleared, the organization can benefit from global dashboards that highlight high-performing plants, identify underutilized resources across the network, and provide a truly unified picture of the company’s manufacturing footprint.
How Does the Work-in-Progress Valuation Benefit From Automated Reporting?
Work-in-Progress (WIP) represents a significant portion of a manufacturer’s assets, yet it is often one of the most difficult figures to track accurately in real-time. Power BI automates this process by pulling live data from the value entries and production order lines in Business Central. This provides a constant, visual representation of the capital currently tied up in unfinished goods, allowing for better cash flow management and more accurate financial reporting.
Beyond the financial implications, WIP reporting serves as an operational health indicator. If the value of WIP is steadily increasing while output remains flat, it suggests that production is starting more orders than it can finish, leading to cluttered shop floors and extended lead times. Power BI can highlight “aged WIP,” identifying production orders that have been open for an unusually long time without any posting activity. By focusing on clearing these bottlenecks, a manufacturer can reduce its investment in inventory and improve its overall throughput.
What Are the Technical Challenges of Blending ERP Data with External IoT Sensors?
Integrating Internet of Things (IoT) data with Business Central through Power BI offers immense potential but presents several technical challenges. The first is the sheer volume of IoT data; sensors may generate thousands of readings per minute, which can easily overwhelm an ERP system if not managed correctly. The best practice is to process this high-frequency data outside of Business Central, using tools like Azure IoT Hub, and only send aggregated summaries or “exception alerts” to the Power BI dashboard where they can be compared against the production schedule.
The second challenge is data synchronization. Ensuring that a sensor reading from a specific machine at 10:15 AM is correctly associated with the specific production order that was running on that machine at that exact moment requires precise timestamping and robust data modeling. This “contextualization” is what turns raw sensor data into meaningful manufacturing intelligence. Despite these challenges, the ability to see a live correlation between machine performance and product quality is a powerful tool for reducing waste and moving toward a predictive maintenance model.
What Does the Future Hold for Predictive and Prescriptive Manufacturing Analytics?
The transition from “what happened” to “what will happen” marks the next frontier in manufacturing intelligence. As Microsoft continues to integrate artificial intelligence and machine learning through tools like Copilot and Fabric, the focus is shifting toward predictive and prescriptive analytics. In this future landscape, Power BI will not just report on past scrap rates but will use historical patterns to predict a spike in waste before it occurs. This foresight allows managers to intervene early, perhaps by adjusting machine settings or inspecting raw materials, before the problem manifests. Prescriptive analytics takes this a step further by not only predicting a problem but also suggesting the optimal solution. For example, if a bottleneck is predicted in two weeks, the system might suggest a specific re-routing of orders or a shift in labor allocation to mitigate the impact. While this requires a very high level of data maturity and trust in the system’s logic, the groundwork is being laid today through the adoption of structured reporting frameworks. By building a clean and accurate Power BI foundation now, manufacturers are positioning themselves to capitalize on these advanced AI capabilities as they become mainstream.
Summary or Recap
The integration of Power BI with Dynamics 365 Business Central Manufacturing provides a comprehensive framework for turning operational data into a strategic advantage. This synergy emphasizes a standard-first approach, allowing organizations to quickly gain visibility into key areas like capacity utilization, cost variance, and scrap management. The use of semantic models simplifies the complex relationship between various ERP ledgers, making critical information accessible to decision-makers at all levels of the company. Data remains the central focus, and its integrity within the ERP is highlighted as the primary factor determining the success of any business intelligence initiative.
By tailoring dashboards to specific roles, from the executive office to the shop floor, the framework ensures that every user has the relevant facts needed to perform their duties effectively. The discussion also covers the economic realities of licensing and the technical requirements for multi-company consolidation and real-time data freshness. This unified strategy transforms the manufacturing process into a transparent, measurable, and highly optimized operation. As firms adopt these tools, they move away from reactive troubleshooting toward a more proactive and data-driven culture.
Conclusion or Final Thoughts
The analysis demonstrated that the successful implementation of Power BI within a manufacturing context required more than just technical connectivity; it demanded a cultural shift toward data-driven accountability. It revealed that organizations often achieved the greatest gains when they prioritized data integrity at the source and utilized standard reporting tools before pursuing complex customizations. The study concluded that the ability to visualize the production lifecycle in real-time significantly improved the response time to bottlenecks and cost variances. Furthermore, the exploration of multi-company consolidation and IoT integration highlighted how scalable these solutions can be for larger enterprises.
Looking forward, the focus must shift toward maturing these data models to support the next generation of AI-enhanced operations. Manufacturers should begin by auditing their current Business Central posting processes to ensure that the foundation for advanced analytics is robust. Investing in staff training to interpret these visual insights is just as important as the technological deployment itself. As predictive tools become more prevalent, those who have established a clean and integrated data ecosystem will be best positioned to lead their industries. Ultimately, the move toward manufacturing intelligence is a continuous journey of refinement that turns every production order into a lesson for future improvement.