

Examining the Convergence of Institutional Retraction and Macroeconomic Pressure on XRP
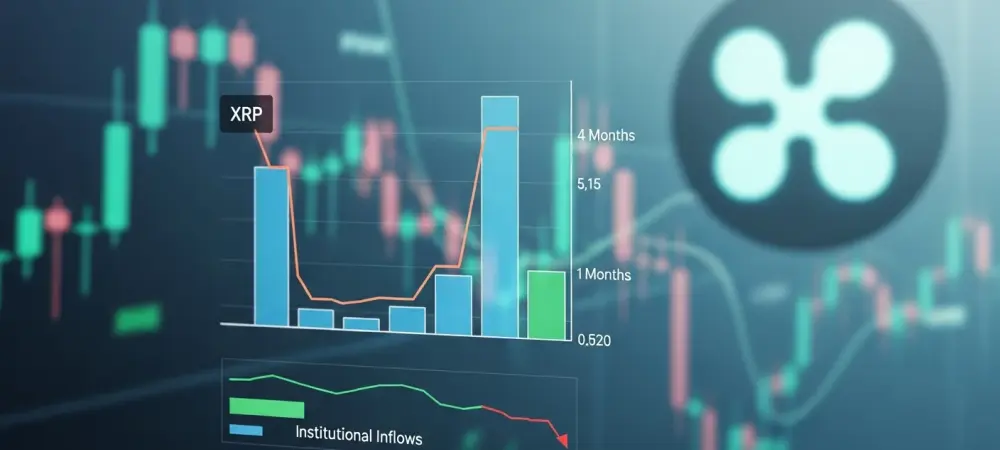
The digital asset landscape witnessed a jarring realignment in early June 2026 as XRP plummeted to a four-month low of $1.15, signaling a stark departure from the optimistic institutional narrative that had previously sustained its valuation and market position throughout the spring. This sudden correction did not occur in a vacuum; rather, it was the culmination of a cooling period in institutional inflows which had previously provided a robust buffer against retail volatility. As the streak of net positive capital entering XRP-linked spot exchange-traded funds terminated, the asset lost its most critical support levels, leaving it exposed to the whims of a cautious market.
Moreover, this price action was heavily influenced by a shifting global macroeconomic environment characterized by a “risk-off” sentiment. Investors reacted to hawkish signals from the Federal Reserve, which hinted at sustained interest rates in response to stubborn labor data. This broader financial pressure forced a rotation out of altcoins, with XRP bearing a significant portion of the burden due to the absence of the institutional demand that had stabilized its price during earlier bouts of macro uncertainty. The convergence of these factors created a perfect storm for a breakdown toward levels not seen since the start of the year.
Contextualizing the $10 Billion Market Cap Erosion and the Displacement of XRP by USDC
The severity of the retreat is best understood through the lens of market capitalization, as XRP saw over $10 billion in value evaporate in a matter of days. Before this descent, the asset had maintained a relatively stable footing near the $1.50 range, anchored by consistent professional bidding. However, the breach of the $75 billion market cap threshold was a psychological turning point for the market. This decline allowed the stablecoin USDC to displace XRP in the rankings, pushing it down the list of the largest digital assets and highlighting the current preference for liquidity over speculative growth.
For leveraged market participants, this volatility served as a harsh reminder of the risks inherent in top-tier altcoins. The displacement of XRP from its long-held position in the top five assets reflected a broader trend where stability began to outpace utility-driven valuation. Institutional investors, who typically view market cap rankings as a measure of relative safety and liquidity, were forced to re-evaluate their exposure as the asset fell through what many considered to be a reliable floor. This erosion of value and rank has lasting implications for how the asset is perceived by large-scale capital allocators.
Research Methodology, Findings, and Implications
Methodology
The study employed a quantitative analysis of institutional flow data and assets under management (AUM) trends specifically covering the window from late April 2026 to early June. By tracking the net changes in spot ETF balances, the research identified the exact moment when the “marginal buyer” disappeared from the market. This data was cross-referenced with on-chain utility metrics, including a detailed audit of active address surges on the XRP Ledger, to determine if network growth was translating into price appreciation.
Additionally, a technical assessment of price chart patterns was conducted to identify the structural triggers of the sell-off. This involved analyzing a symmetrical triangle breakdown on the daily timeframe and calculating the total volume of leveraged liquidations that followed. By synthesizing these different data streams, the methodology provided a holistic view of the forces driving the price toward its local bottom.
Findings
The investigation uncovered a phenomenon described as “basis compression,” where record-high ETF assets under management failed to drive new price gains. Despite the size of these funds, the lack of new buyers at the $1.43 level meant that any distribution from existing holders directly impacted the price. Furthermore, a significant divergence was observed between network activity and market value; even as active addresses peaked at 46,767 in mid-May, the price remained suppressed by heavy sell-side pressure.
The data confirmed that the breach of the $1.30 and $1.14 support zones was largely catalyzed by $30 million in leveraged liquidations. These forced sales created a feedback loop that accelerated the price drop, effectively clearing out the long positions that had built up during the month of May. This “flush” was necessary for the market to reach a point of temporary equilibrium, though it came at the cost of significant technical damage to the asset’s recovery path.
Implications
The primary implication of this correction is the transformation of the $1.40–$1.45 price range from a reliable support zone into a formidable overhead resistance area. Any future attempts at recovery will likely face significant selling pressure as previous buyers look to exit at breakeven points. This shift suggests that the path to reclaiming previous highs will be slower and more difficult than the initial ascent, requiring a substantial catalyst to overcome the newly formed resistance. Furthermore, the research suggests that fundamental developments, such as the expansion of the RLUSD stablecoin, are currently playing a secondary role to macroeconomic factors. In a high-interest-rate environment, the utility of the XRP Ledger is being overshadowed by broader financial data like U.S. labor reports. This makes top-tier altcoins more vulnerable to traditional market trends, decreasing their ability to decouple from the performance of legacy financial assets.
Reflection and Future Directions
Reflection
The “liquidation-driven flush” served as a reset for market sentiment after a period of prolonged institutional stagnation. While the loss of value was significant, it removed the excessive leverage that had made the market top-heavy and sensitive to minor price fluctuations. However, the event also highlighted the challenges of maintaining valuation tiers when institutional buying streaks end abruptly. Without a constant influx of fresh capital, even assets with high on-chain utility struggle to defend their market positions against aggressive sell-offs.
It was also recognized that on-chain metrics, while positive, have limitations as short-term price stabilizers. The surge in active addresses demonstrated that the XRP Ledger remained a hub of activity, yet this utility did not provide the expected price floor. This suggests that the market currently values institutional liquidity flows far more than the actual usage of the network when determining short-term price discovery.
Future Directions
The focus now shifts toward monitoring the $1.14 structural floor for signs of long-term “price memory” and defensive stability. If this level holds, it could serve as a foundation for a gradual accumulation phase. The potential for a resumption of institutional bidding remains a key area of investigation, specifically looking for how the Federal Reserve’s future stance might impact capital rotation back into digital assets.