

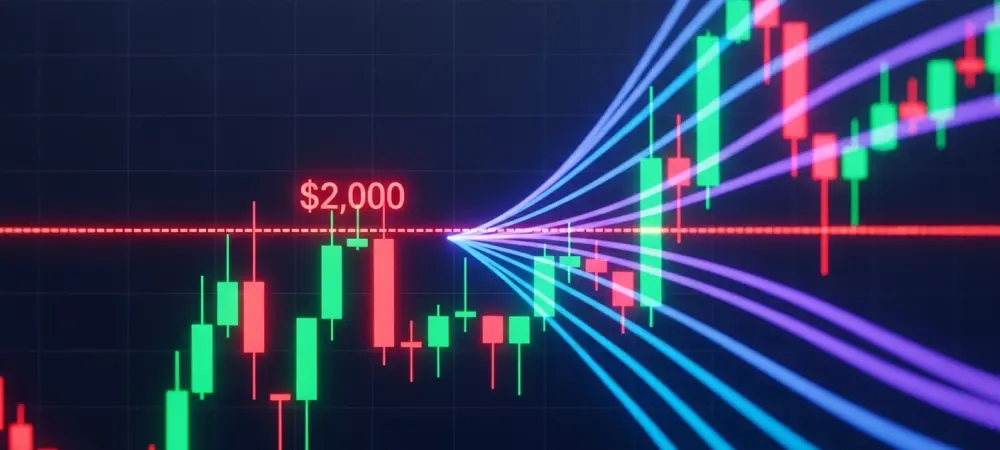
The Ethereum ecosystem is currently navigating a pivotal moment in its market cycle as it attempts to break through the psychologically significant $2,000 mark after months of volatility. This specific price point represents more than just a round number; it serves as a litmus test for the sustainability of the recovery that began following the market lows recorded in June. Currently, the second-largest cryptocurrency by market capitalization is balancing a notable surge in institutional interest against a formidable resistance cluster that has historical significance for long-term traders. This price action occurs within a broader market context where both fundamental data and technical indicators are beginning to align, creating a high-stakes environment for retail participants and institutional holders alike. As the network continues to evolve, the ability to flip this specific resistance into support could dictate the trajectory of the decentralized finance sector for the rest of the year.
Institutional Backing and Technical Confluence
The recent push toward the $1,930 level is largely underpinned by consistent capital entering the ecosystem through U.S.-based spot Ethereum ETFs, which have fundamentally changed the liquidity profile of the asset. Significant net inflows, particularly those led by BlackRock’s ETHA fund, suggest that institutional players are viewing current price levels as an attractive entry point rather than a local peak. This institutional appetite is providing a sturdy floor for the asset, helping it sustain upward momentum even as it approaches major technical hurdles that previously halted growth. Unlike the retail-driven surges of the past, this current movement is characterized by steady, programmatic buying that reduces the likelihood of a flash crash. Professional money managers appear to be positioning themselves for a long-term hold, signaling a maturation of the market that favors stability and gradual appreciation over the erratic swings typically associated with crypto assets.
Furthermore, the $2,000 level represents a sophisticated confluence zone where three distinct technical signals overlap, creating a massive hurdle that buyers must clear to regain full control. Ethereum is currently contending with the 100-day Simple Moving Average, the 0.5 Fibonacci retracement level, and the upper boundary of an ascending channel that has governed its price action since the middle of June. Because these indicators converge at nearly the same price point, breaking through will likely require a significant catalyst or a substantial spike in trading volume that exceeds recent daily averages. Traders often view such intersections as high-probability areas for a reversal, which explains the increased selling pressure observed as the price nears this mark. However, a successful breach would likely trigger a wave of short-covering, potentially accelerating the move toward higher targets as algorithmic trading bots flip their bias from bearish to bullish in a very small window of time.
Support Infrastructure and Strategic Direction
If the digital asset fails to overcome the immediate $2,000 barrier, the focus of the market will immediately shift to its hierarchy of support levels to see if the recovery remains intact. The most immediate floor sits at $1,920, a level that previously acted as a ceiling and must now provide stability for the bulls to maintain their current positioning. Below that, the $1,870 and $1,730 zones serve as critical safety nets that must hold to prevent a total breakdown of the rally that has defined the summer months. The $1,730 level is particularly noteworthy as it aligns with the 50-day moving average, representing the ultimate line in the sand for short-term trend followers. As long as these levels remain unviolated on a daily closing basis, the overall structural integrity of the market remains positive, suggesting that any dip toward these areas would likely be met with renewed buying interest from those who missed the initial move earlier.
For a definitive bullish trend to be confirmed, market participants sought more than just a brief touch of the $2,000 mark; the asset needed to close above it and retest the area as a new support floor. Flipping this resistance signaled that the market successfully absorbed the selling pressure associated with mid-term moving averages and the critical Fibonacci midpoint. This transition allowed investors to pivot their strategies toward higher targets such as $2,100, while maintaining strict risk management protocols at the newly established base. Future considerations focused on the continued monitoring of ETF flow data and macro-economic shifts to ensure that the liquidity remained available for sustained growth. By establishing a firm foundation above the psychological barrier, the network positioned itself to lead the next phase of market expansion, providing a clear roadmap for those looking to capitalize on the cycle. Investors recognized that patience during the consolidation was the most effective strategy.